
Every engineer wants to ship high-quality software systems, but the “how” isn’t always straightforward. To help, we designed a testing series, “Shipping code quickly with confidence.” Using code from sendsecure.ly, a Basis Theory lab project, readers will bring together the testing layers and strategies used by our data tokenization platform to achieve its 0% critical and major defect rate. You can find the links to all published articles at the bottom of each blog.
Welcome back to the fifth installment of our testing series! So far, we’ve covered the testing fundamentals we practice at Basis Theory, our approach to API and UI Acceptance and Integration Testing, and how we leverage Synthetic Tests to monitor the health of our production environment. This post will dive into how we leverage Load Tests to ensure our application remains performant in production when handling peak traffic volumes.
Load Tests
Some applications and hosting environments may perform flawlessly under normal usage patterns, but start to behave unexpectedly when the system is under elevated load or extreme conditions. This can result in unacceptably slow response times or increased error rates, degrading the experience for your end-users. Instead of waiting to uncover and troubleshoot these problems in a heavily trafficked production environment, Load Tests can help you proactively identify and address performance issues before your users find them.
What are Load Tests?
Load Tests simulate user behavior against your application and can mimic various load patterns, allowing you to observe and gather information about how your system behaves under load. These checks can either focus on testing a) a single operation or API endpoint in isolation or b) an entire user journey across several operations or API endpoints.
What can Load Tests be used for?
Many Load Testing frameworks allow a test to be executed with many different execution parameters, such as the number of users, the frequency or the total number of requests, or the test duration. By varying these parameters, the same tests can be written once and leveraged for many different purposes.
Types of Load Tests
Performance Tests assess the performance of your system and ensure you meet predefined performance metrics, such as SLAs. Setting performance goals and tracking metrics over time ensures that your application performance does not inadvertently degrade as the system evolves.
Stress Tests help determine how your system behaves under extremely heavy load. These tests can be useful to help identify the maximum load your system can handle before reaching the breaking point, and also can help in identifying what the bottlenecks are that lead to failure.
Soak Tests help determine how your system performs under long-term sustained load. These tests can be useful in identifying memory leaks or other issues related to resource constraints becoming exhausted over time.
This post will focus on writing performance tests; however, our implementation could be leveraged for Stress and Soak tests with minimal changes.
Choosing a Load Testing framework
There are many Load Testing frameworks available, each offering a unique set of features and benefits. While evaluating the available tooling, the Basis Theory engineering team identified the following attributes as particularly important to us:
- Local test execution
- Easy to test REST APIs
- Can write tests in code, using a well-known language
- Can export and track performance metrics over time
- Configurable parameters to define load pattern
- Simple to integrate into CI/CD pipeline
- Free and open source
We suggest you formulate a similar list of desired attributes when evaluating the available tooling and choosing your Load Testing framework. The following questions may help you in identifying which attributes are most important to your team:
- Who is going to write and maintain the Load Tests?
- Where do you want the tests to run? Within existing CI/CD tooling or a dedicated cloud execution environment?
- How and where do you want to track performance metrics? Does the tool have an existing integration?
- How much money are you willing to spend on this service?
We ultimately chose k6 for writing Load Tests and executing them from our existing CI/CD tooling on GitHub Actions. However, your team may have different needs and may find another more suitable tool. Next, let's walk through how to Load Test an application and see some specific examples using k6.
How to write Load Tests
We start by writing our Load Tests against the API backing sendsecure.ly. Our goal is to ensure that the response times of this API satisfy our desired level of performance. To do so, we will be writing a k6 test that first attempts to create a secret from some secret text, then attempts to retrieve the secret using the created secret’s id.
k6 tests are written in JavaScript and are executed using the k6 CLI. A k6 test is simply a .js file that exports a default function containing your test code, for example:
Before we jump into the full solution, let’s first explore some general Load Testing concepts and how to use corresponding features within k6. All of the code shown below is available here on GitHub.
Executes HTTP requests
While it is possible to write UI-based Load Tests, we focus on creating Load Tests against a REST API. For this reason, our Load Testing framework must enable us to execute HTTP requests and capture the response times of each request.
k6 provides an http module that makes it extremely simple to execute HTTP requests from within your tests. This module includes the infrastructure required to automatically capture basic performance metrics for each request. The following code snippet shows how we create a secret by executing a POST request to the API:
Captures and outputs metrics
Load Tests should provide empirical data to developers that can aid in analyzing and improving system performance – the testing framework should measure system performance and produce metrics that are easily accessible and understandable.
By default, k6 outputs several basic metrics to stdout, such as the duration across all HTTP requests, or the time spent waiting for a connection to the API. While this information provides a quick understanding of what happened during a test, developers often need more detailed metrics. For example, if multiple API requests occur within the same test, we typically want to track the performance of each operation separately.
Fortunately, k6 makes it easy to define custom metrics. A Trend is a particularly useful type of custom metric that allows you to capture a sequence of values and summarize various statistical values for the sequence (e.g. avg, min, max, p(90), p(95)). This can be used to separately aggregate metrics for each type of HTTP request made during a test. For example, in our test we first create a secret, then retrieve the secret from the API by its id, recording the request duration to a Trend for each operation.
Objective-driven assertions
Good Load Testing frameworks collect and report metrics in a human-readable format, enabling follow-up analysis and decision making. Great Load Testing frameworks, however, automatically ensure your system satisfies specific performance objectives through codified assertions.
Thresholds in k6 provide a way to assert whether the performance metrics captured by a test meet predefined criteria. For example, you can assert that the average create_duration is less than 200ms, or that 90% of all requests in the retrieve_duration metric have a response time below 500ms.
Thresholds are defined with the options export (an optional const that can be exported from your test).
Test configuration and reuse
As with any software, it pays to focus on writing clean code and striving for code reuse within your tests. It can be beneficial to write a test that can be configured to run across many environments and usage patterns. You should avoid hard-coding API URLs, API keys, or other parameters in tests that can vary across environments.
The k6 CLI enables test reuse by allowing environment variables to be specified when executing tests. Declared environment variables are made available within the global __ENV variable within a test. For example, we can specify the base URL of the API within an API_URL environment variable within the k6 CLI command:
And access this environment variable within our test:
To enable the same test to be executed under several different load patterns, k6 supports specifying the number of virtual users, the number of test iterations, or the total test duration as CLI arguments:
Putting it all together
We’re now ready to define our entire k6 Load Test using all the concepts explored above.
For each test iteration, we create a secret through the API and retrieve the secret through the API by its id. We are tracking the performance of each of these API calls within separate Trends. And we are asserting the following thresholds are satisfied:
- The total number of failed HTTP requests must be less than 1%
- 90% of create requests complete in less than 300ms
- 90% of retrieve requests complete in less than 500ms
Further Considerations for Load Tests
When to run Load Tests
Continuous Performance Tests
Automating Load Tests during the CI process ensures new commits or PRs won't degrade system performance. This is a practice known as continuous performance testing. Running performance tests with every build gives immediate feedback about whether a commit introduces a severe performance regression.
One caveat to be aware of: we have found that running performance tests on CI infrastructure can sometimes produce inconsistent results, leading to flaky threshold violations. If you run into similar issues, consider making your continuous performance tests a non-blocking check within your CI process or only produce a warning on failures.
Stress and Soak Tests
Run these tests manually when you wish to gather information about the performance of your system and infrastructure under extreme conditions. Your goal is to push your system to the breaking point, so expect to have the resources available to troubleshoot any issues that may arise.
Where to run Load Tests
At Basis Theory, we have found running Load Tests against a pre-production environment that closely mimics your production infrastructure to work best. Think of Load Tests, especially stress and soak tests, as experimental. Your tests may end up exposing a critical issue that brings your systems down, so it is best to not interrupt your production user base and business operations.
Performance tests work best when run in your CI process against a non-production preview environment of your application, but only if you have the infrastructure in place to produce such a preview environment with every build. In lieu of a preview environment, engineers can check performance against their development or testing environment. The goal is to identify performance issues as early in your SDLC as possible, and especially before promoting a release candidate to your production environment.
Defining thresholds
The process of defining thresholds is more an art than a science. It can take several test iterations to identify the current performance metrics of your application within an environment and to refine your thresholds. You should strive to keep thresholds as low as possible to ensure that regressions are caught early, but not so low that you inadvertently introduce flakiness into your test results.
Also, every environment in which you host your application may require different thresholds, depending on the hosting infrastructure and scaling parameters of that environment. For this reason, we Load Test in an environment that closely resembles our production environment.
It can be valuable to formally define target SLAs to anchor your choice of thresholds. If you do not have an SLA to anchor your thresholds, you should be aware of threshold creep—or the temptation to slightly increase your thresholds every time a failure happens. Instead, developers should be prepared to invest time into debugging performance issues and maintaining your application’s performance.
Tracking metrics and trends
Metrics produced by your Load Testing framework should be captured over time to help you spot trends or investigate historical performance data. There are many options available for the aggregation and visualization of these metrics. At Basis Theory, we opted to use Datadog for this purpose. Configuration was as simple as configuring the k6 Datadog Agent to run within GitHub Actions when we run our performance tests.
Pulse check: Confidence level
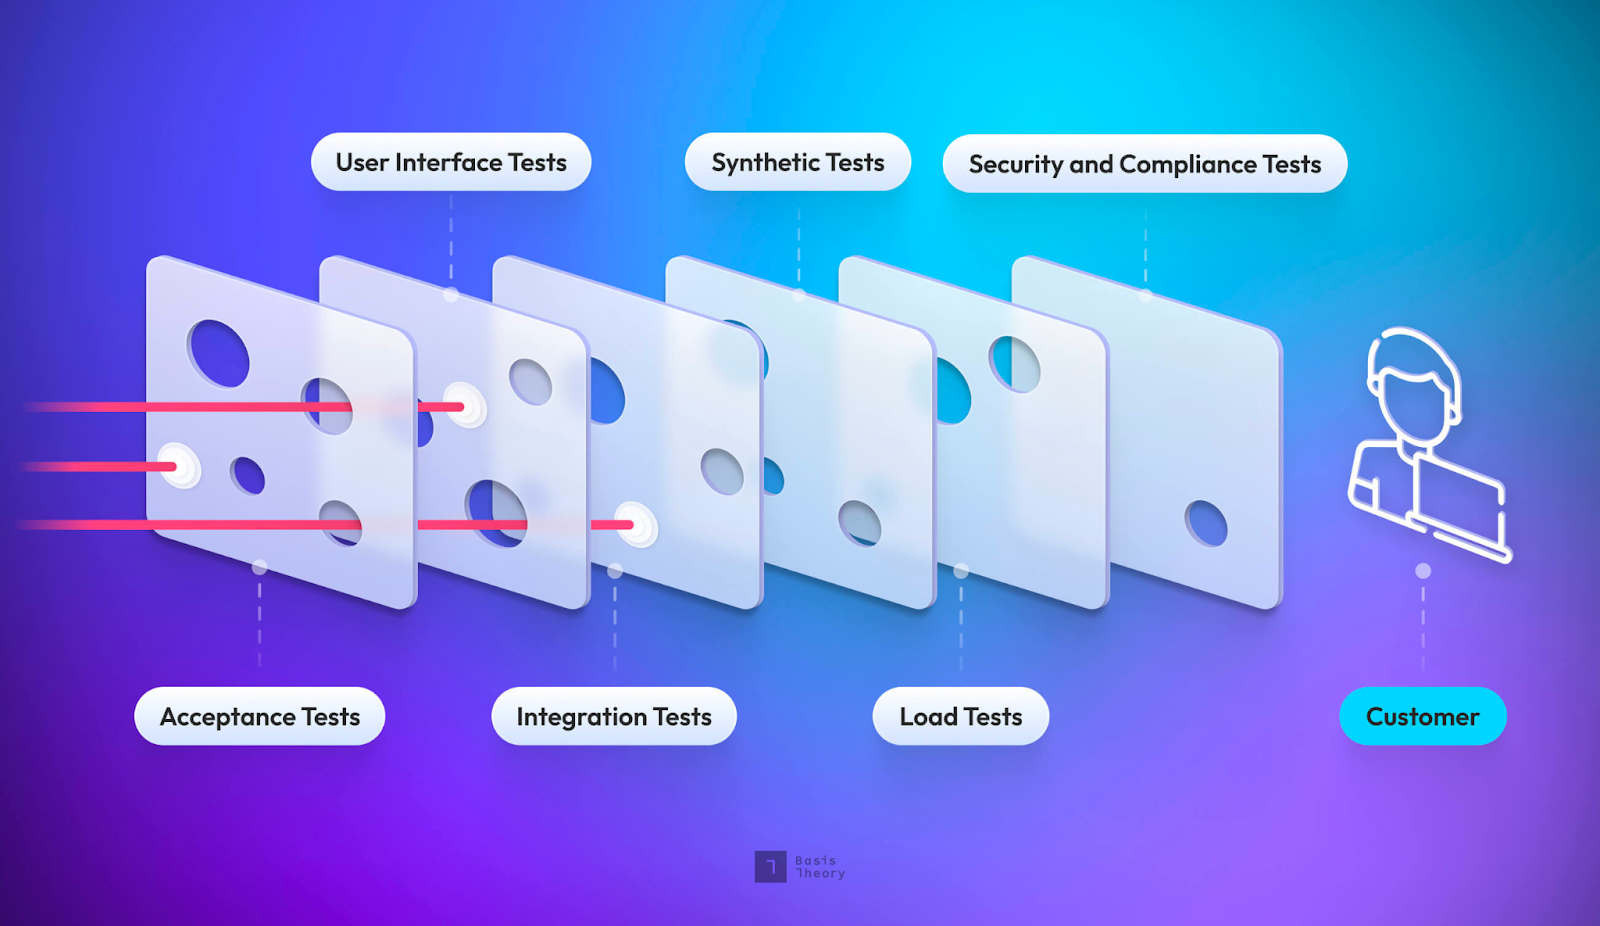
The goal of any test is to add confidence that the code, application, or system behaves as expected. So far, we’ve covered Acceptance and Integration Tests, Synthetic Tests, and now Load Tests. How confident are we now?
Are we confident that the application’s programmable interface does what we expect? Yes, the API Acceptance Tests provide this confidence by validating the system's behavior across various happy and sad-path scenarios.
Are we confident that the application can communicate with external dependencies? Yes, API Integration Tests provide confidence that our application can communicate and receive traffic from external dependencies in a deployed environment. E2E Integration tests cover the systems as a whole, replicating user behavior in a production-like environment.
Are we confident that the application’s user interface does what we expect? Yes. The UI Acceptance Tests give us confidence that the UI is behaving as expected.
Are we confident that the application is always available? Yes, we are! Synthetic Tests ensure that our application is healthy and available to serve requests.
Are we confident that the application can handle production throughput and beyond? Yes! Load Tests ensure that our application continues to perform when subjected to production-level traffic patterns.
Are we confident that the application is free of security vulnerabilities? No. Not yet, at least.
Are we confident that the application is secure against common attack vectors (e.g., OWASP)? Not yet.
Don't worry. By the end of this series, "Yes" will be the answer to all of the above questions. So stay tuned for our upcoming posts on the remaining testing layers, when to use them, and how they add confidence to our SDLC!
- Testing Layers and Principles
- API Acceptance and Integration Testing
- UI Acceptance and End-to-End Testing
- Synthetic Testing
- Load Testing
- Security and Compliance Testing
Have questions or feedback? Join the conversation in our Slack community!